Working with Data Sources in ContentCreator
Data sources are FirstSpirit's home for structured, reusable content — news, products, locations, authors and more. Instead of retyping the same information on every page, you maintain it once as a dataset and let pages, teasers and even other channels pull it in automatically. This guide walks an editor through browsing a data source, editing a dataset, and placing datasets on a page in ContentCreator.
What are data sources?
A data source is a structured store of content in FirstSpirit — think of it as a table where every row is a self-contained record. In FirstSpirit each record is called a dataset. A single news article, one product, one office location: each is a dataset with the same set of fields.
The value of storing content this way is reuse. A news article maintained as a dataset can appear as a teaser on the homepage, in a filtered "latest news" list, on a category landing page and in a mobile app — all from one record. Edit the dataset once and every place that shows it updates.
Data sources vs. pages
It helps to separate two things in FirstSpirit:
| Pages | Data sources |
|---|---|
| Organised in the site menu tree (Navigation). | Organised as tables of records, independent of the menu. |
| One page = one URL in the site structure. | One dataset = one reusable record, shown wherever it is referenced. |
| Good for unique, hand-crafted layouts. | Good for repeating, list-like content (news, products, people). |
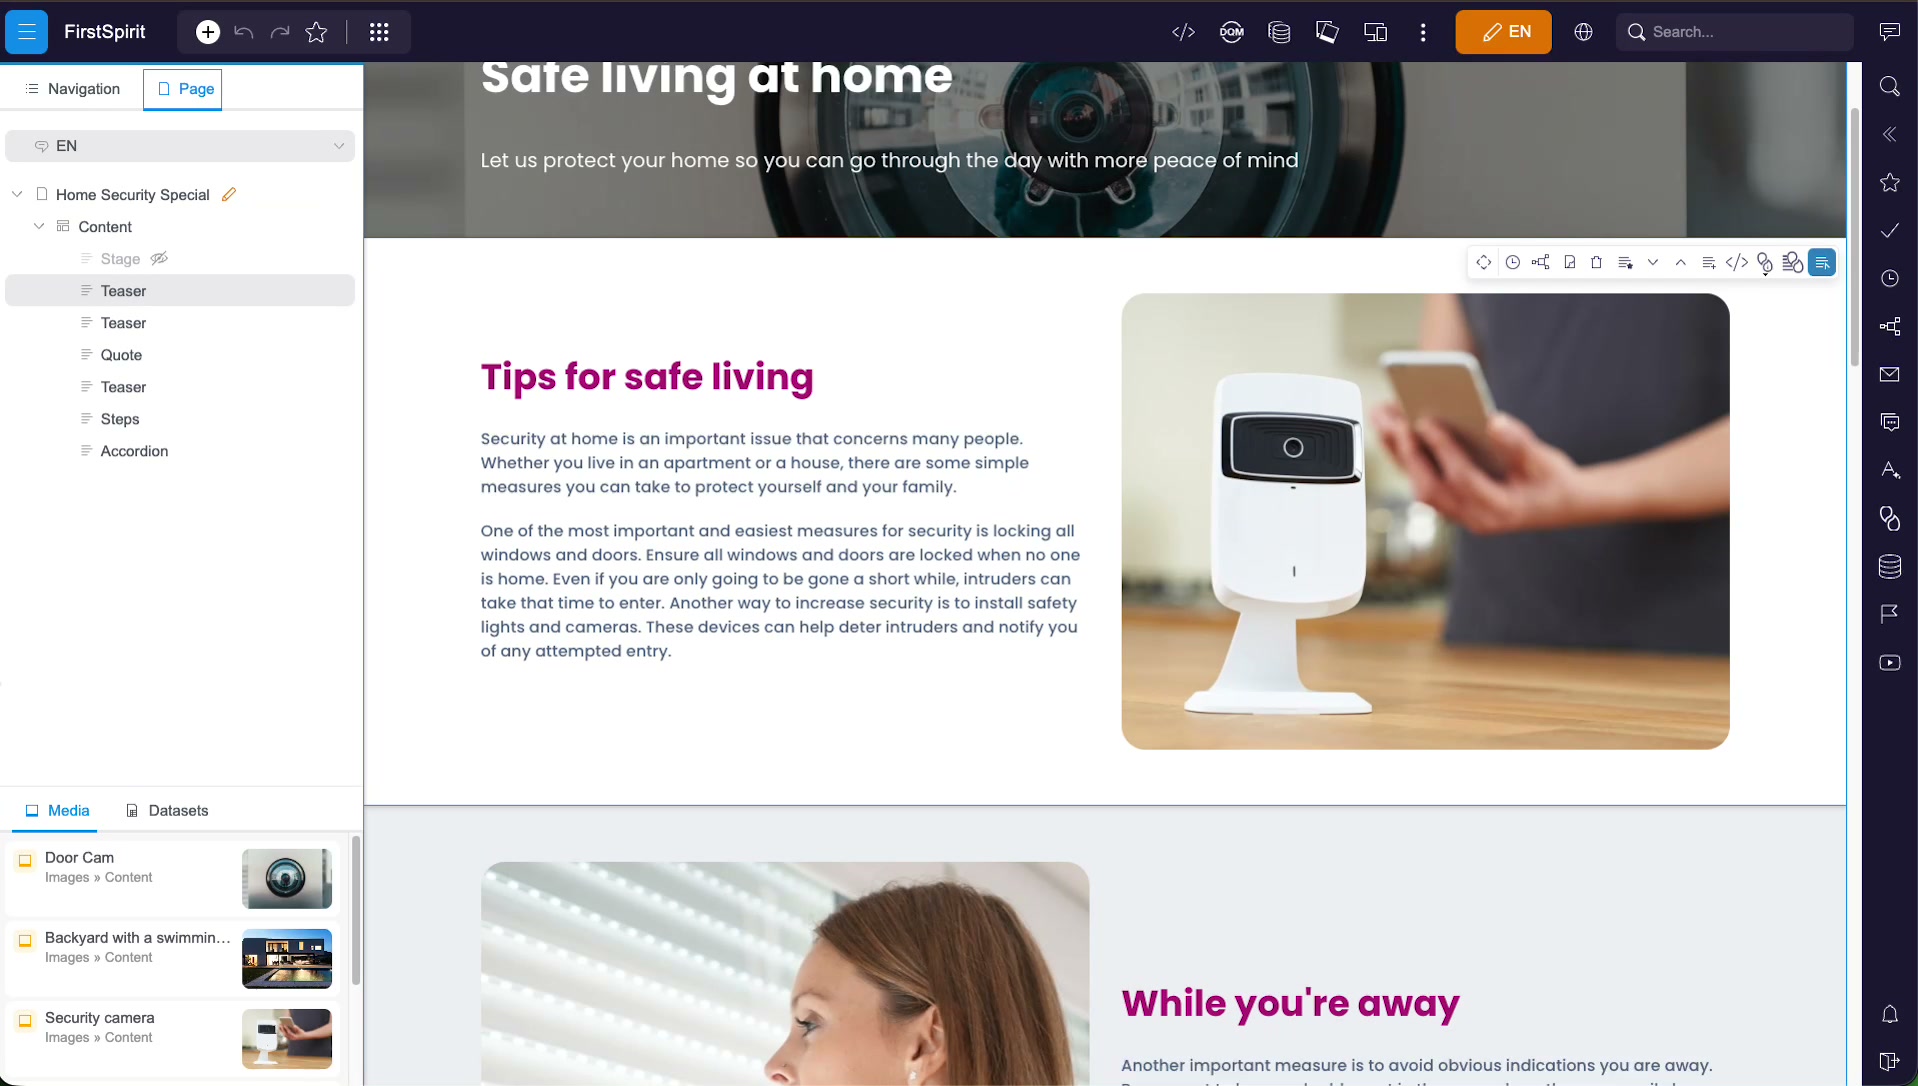
In the ContentCreator editing panel you can see both worlds. The Navigation and Page tabs let you work on the current page and its sections, while the panel at the bottom switches between Media and Datasets — the latter is your quick access to structured records.
Opening the data sources report
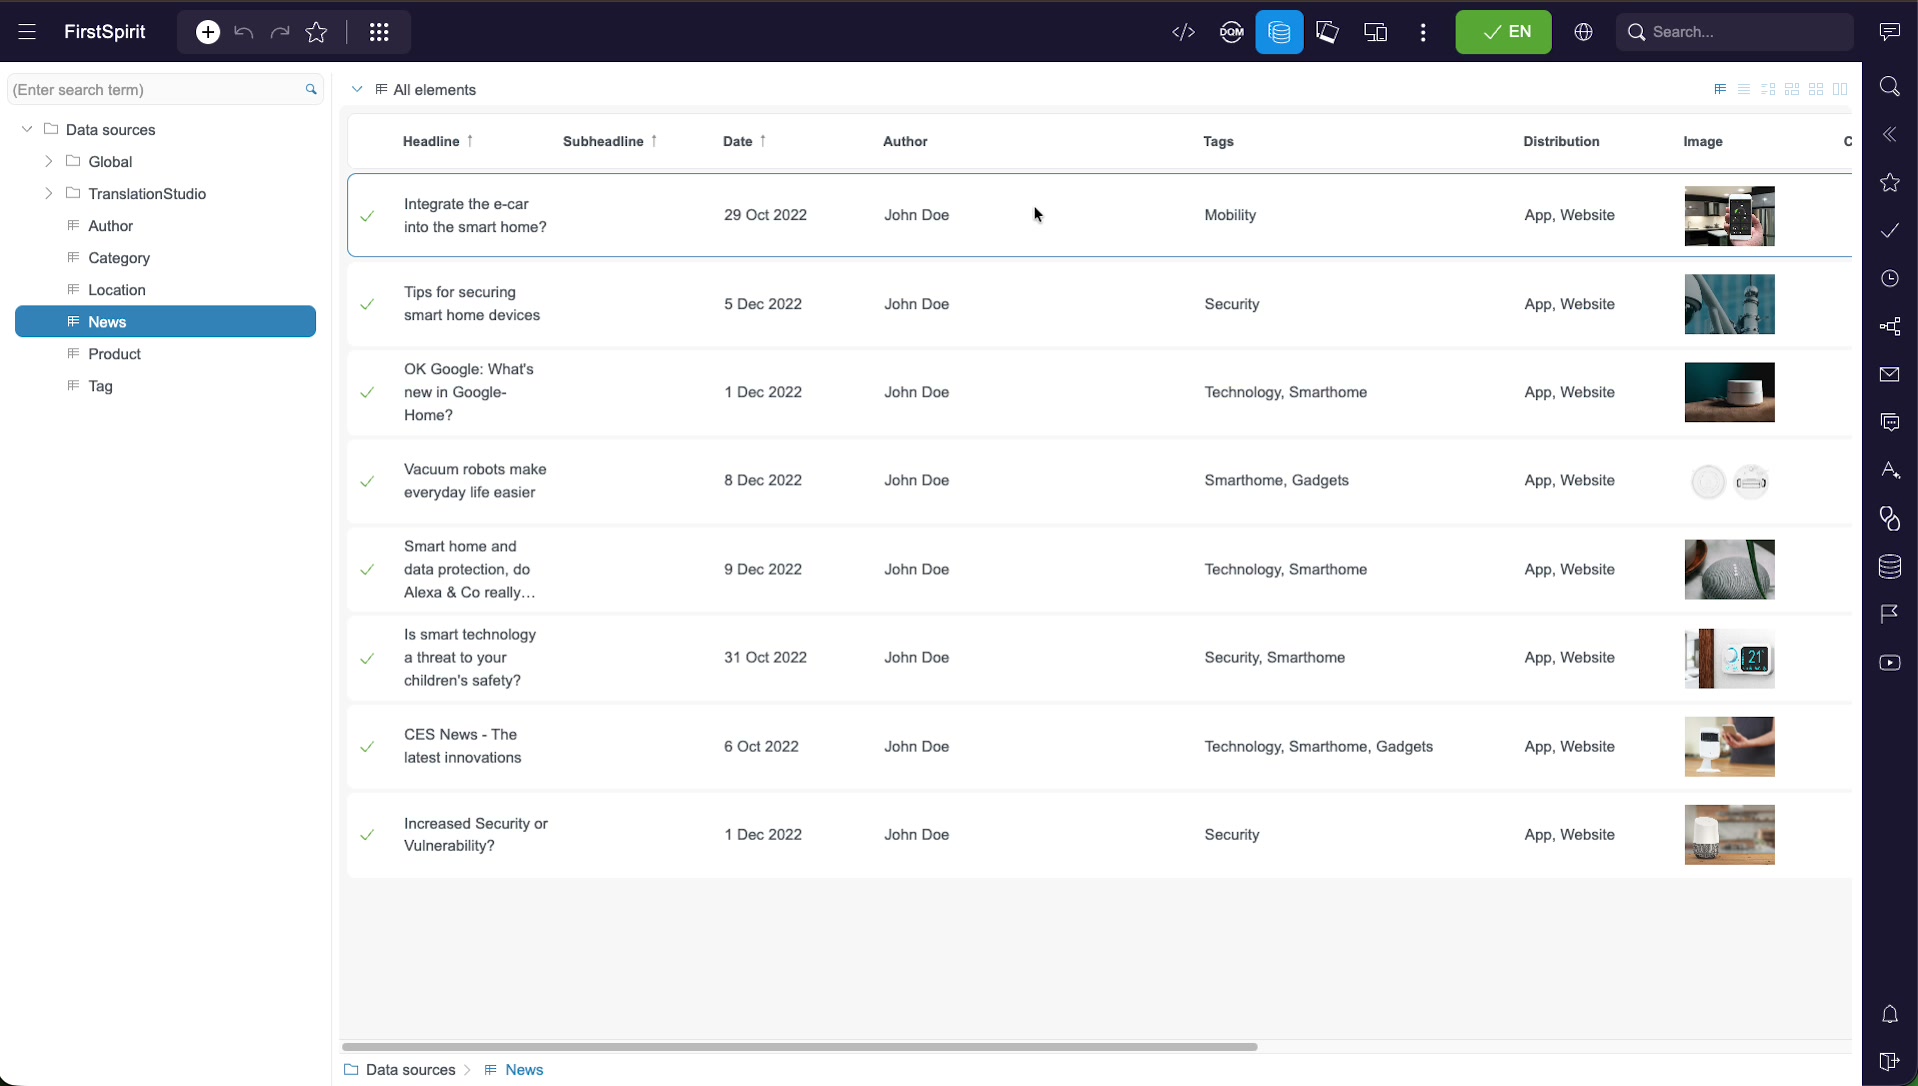
To browse structured content, open the Data sources report from the top toolbar (the stacked-database icon). The report fills the workspace with a left-hand list of the project's data sources and a table of the records inside the selected one.
A typical project groups its structured content into several data sources. In the demo project these include:
| Data source | Holds |
|---|---|
| News | News and blog articles. |
| Product | Product records. |
| Category | Content categories / topics. |
| Location | Offices or store locations. |
| Author | Author profiles referenced by articles. |
| Tag | Reusable tags applied to other records. |
| Global / TranslationStudio | Project-wide and translation-related entries. |
Selecting News shows every news dataset in a table. Each column maps to a field of the dataset — here Headline, Subheadline, Date, Author, Tags, Distribution and Image.
Browsing datasets
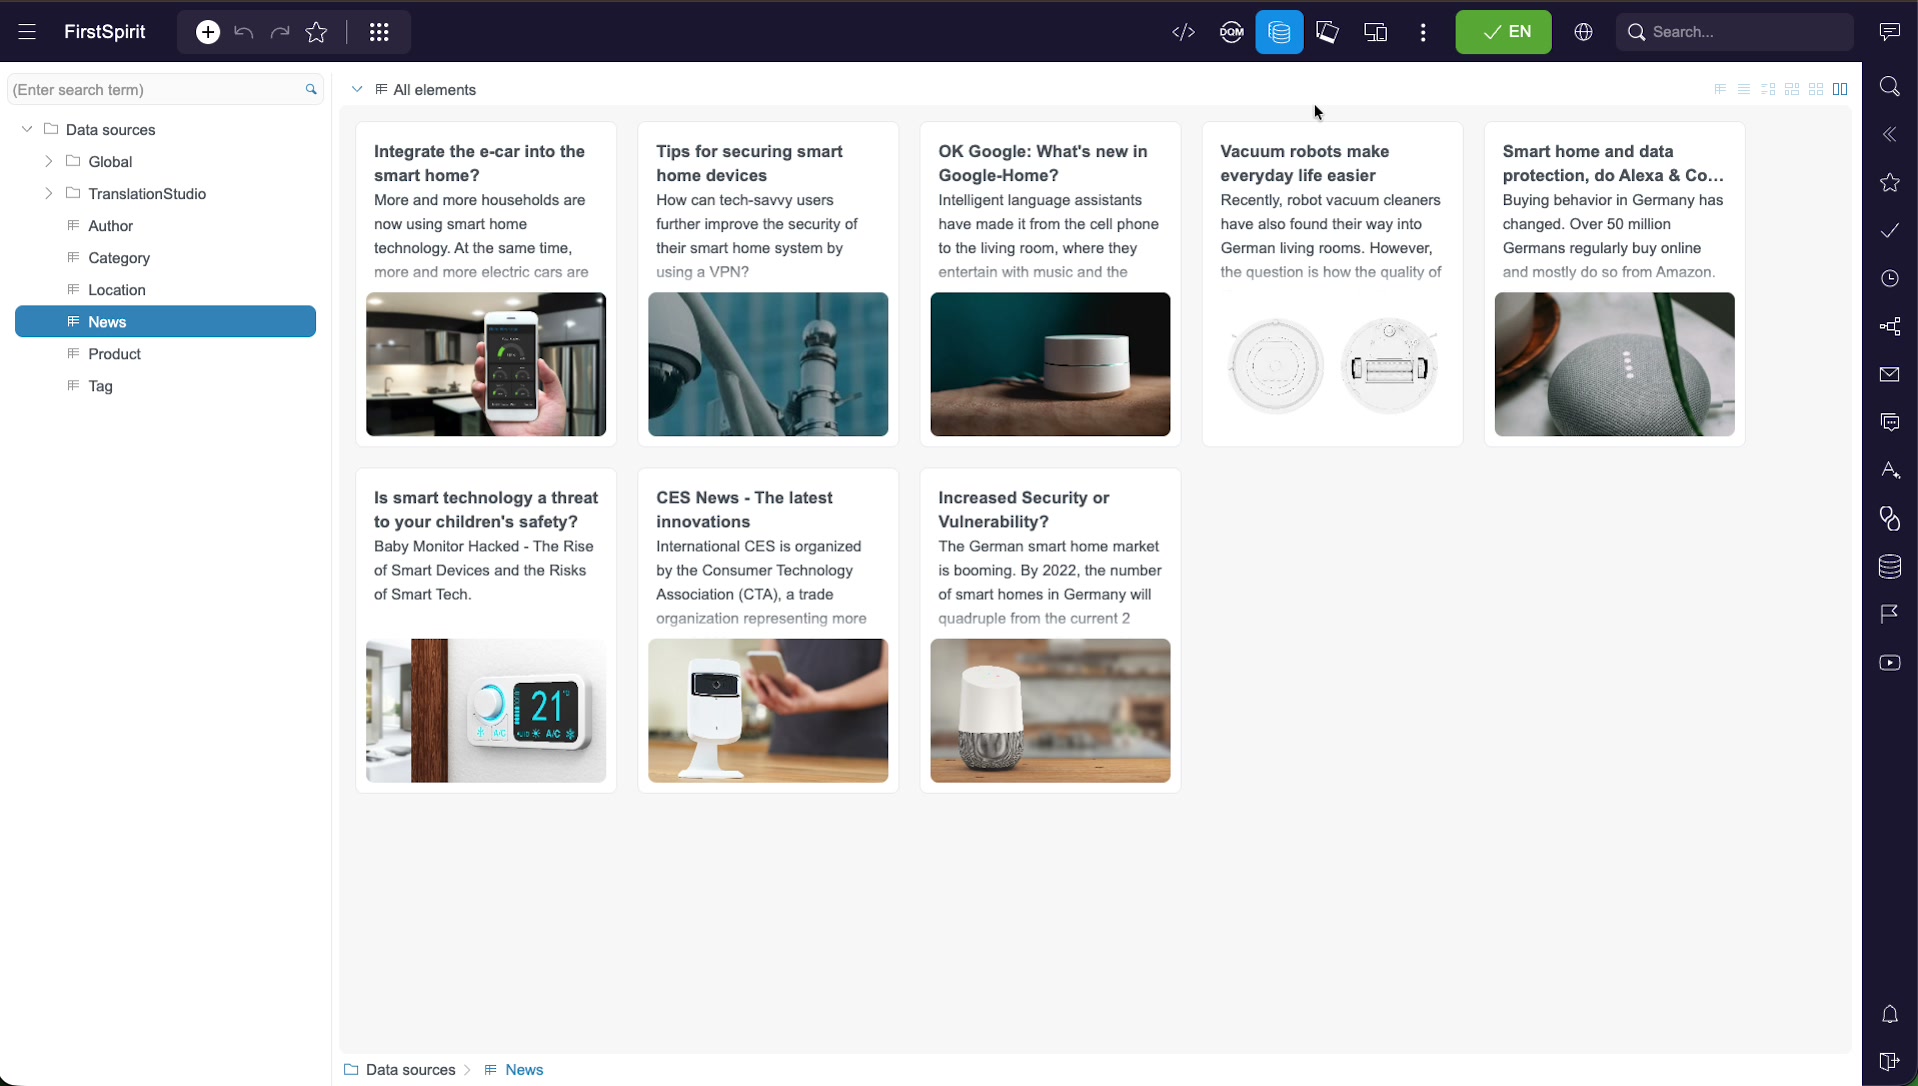
The report offers different ways to look at the same records. Use the view switcher in the top-right of the report to move between a compact list and a card view that previews each dataset's headline, teaser and image — much closer to how the content will actually appear on the site.
Anatomy of a dataset
Open a dataset (double-click a row, or use its context actions) to see the form behind the record. The fields are defined by your project, but a news article typically carries:
| Field | What it holds |
|---|---|
| Headline | The article title, shown on teasers and the detail page. |
| Subheadline / Teaser Text | Short summary text used in list and card previews. |
| Article Text | The full body, edited with a rich-text editor (paragraph styles, bold, italic, links, lists). |
| Image + Alternative Text | The lead image and its accessibility description. |
| Date · Author | Publication date and the author record. |
| Tags | Category tags (e.g. Technology, Security, Smarthome) used to filter and group articles. |
| Distribution | The channels the record is delivered to — for example App and Website. |
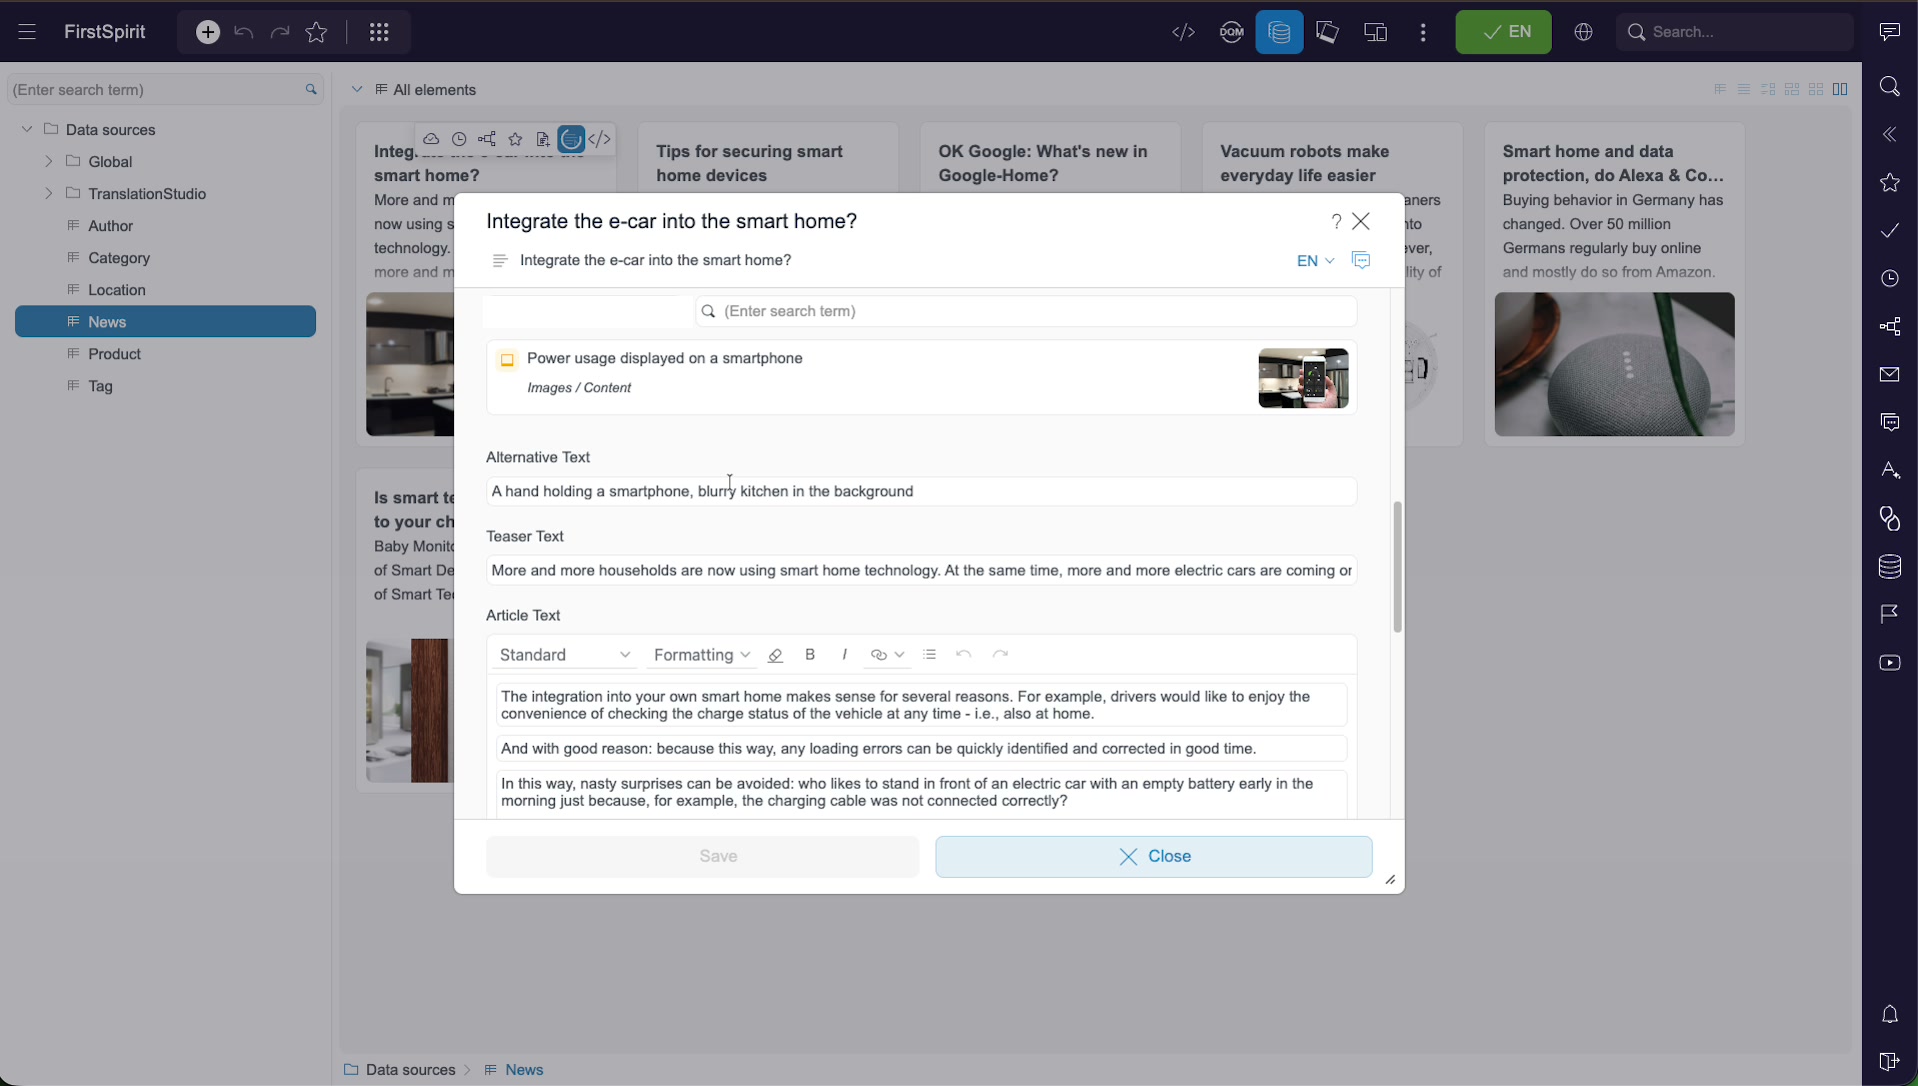
Note: The set of fields and their rules (which are required, how they validate) is defined once by developers in the data source's structure. As an editor you fill them in — you don't design the form.
Editing a dataset
Editing structured content is the same everywhere it is used, because there is only one record behind it:
- Open the Data sources report and select the data source (e.g. News).
- Find the dataset — scroll, switch to card view, or search by keyword.
- Open it to reveal the form, then change the fields you need (headline, teaser, image, body…).
- Click Save. The change is now stored on the record.
- Release the dataset when you are ready for it to go live, following your project's release workflow.
Displaying datasets on a page
Datasets live in the data source, but visitors see them on pages. You surface them by adding a section that is wired to pull records from a data source. What that section is called, which fields it exposes, and how it filters records is entirely up to how each project's templates are built — FirstSpirit itself doesn't ship a fixed "news" or "list" section. One common pattern is a section that shows the latest datasets from a given data source, optionally filtered by some category field; the walkthrough below uses such a section as an illustration.
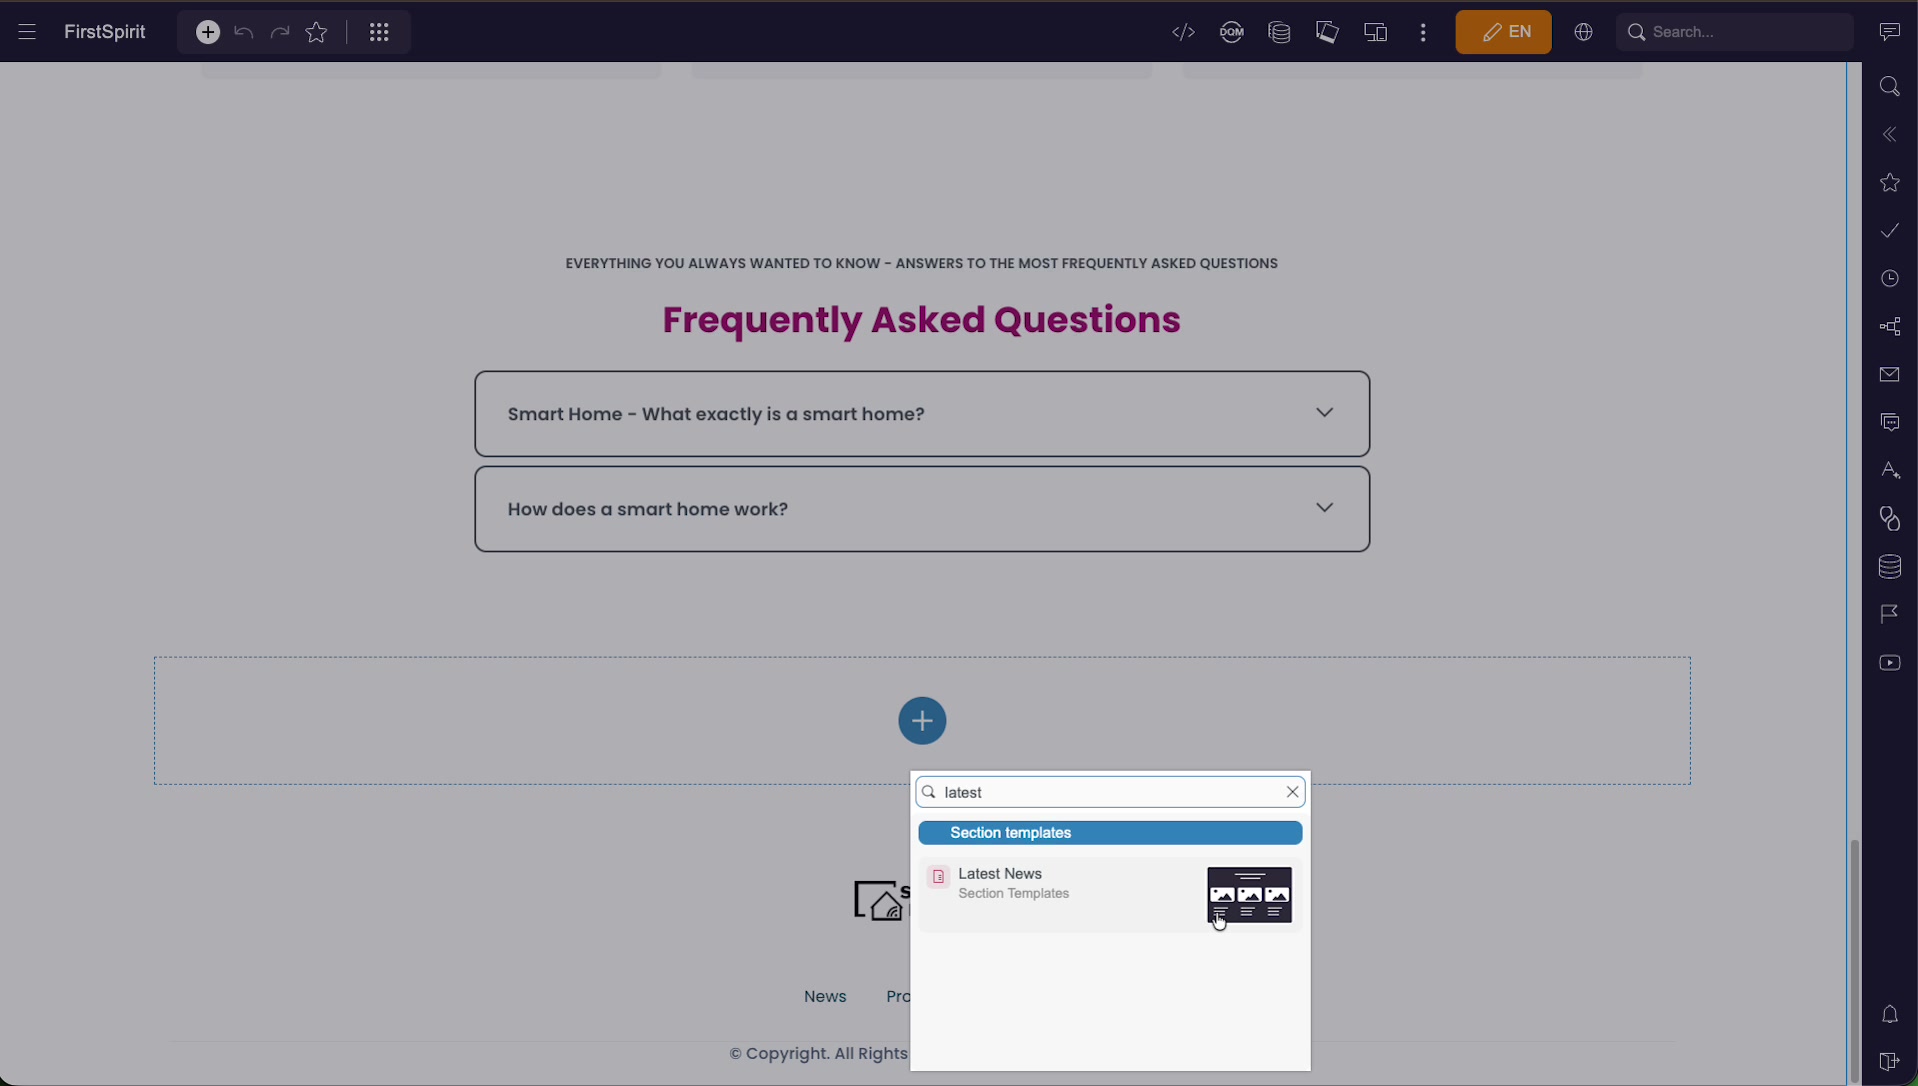
On any page in edit mode, click the + (add content) button in an empty content area. In the section-template picker, search for the section you want and select it.
Configuring a data-driven section
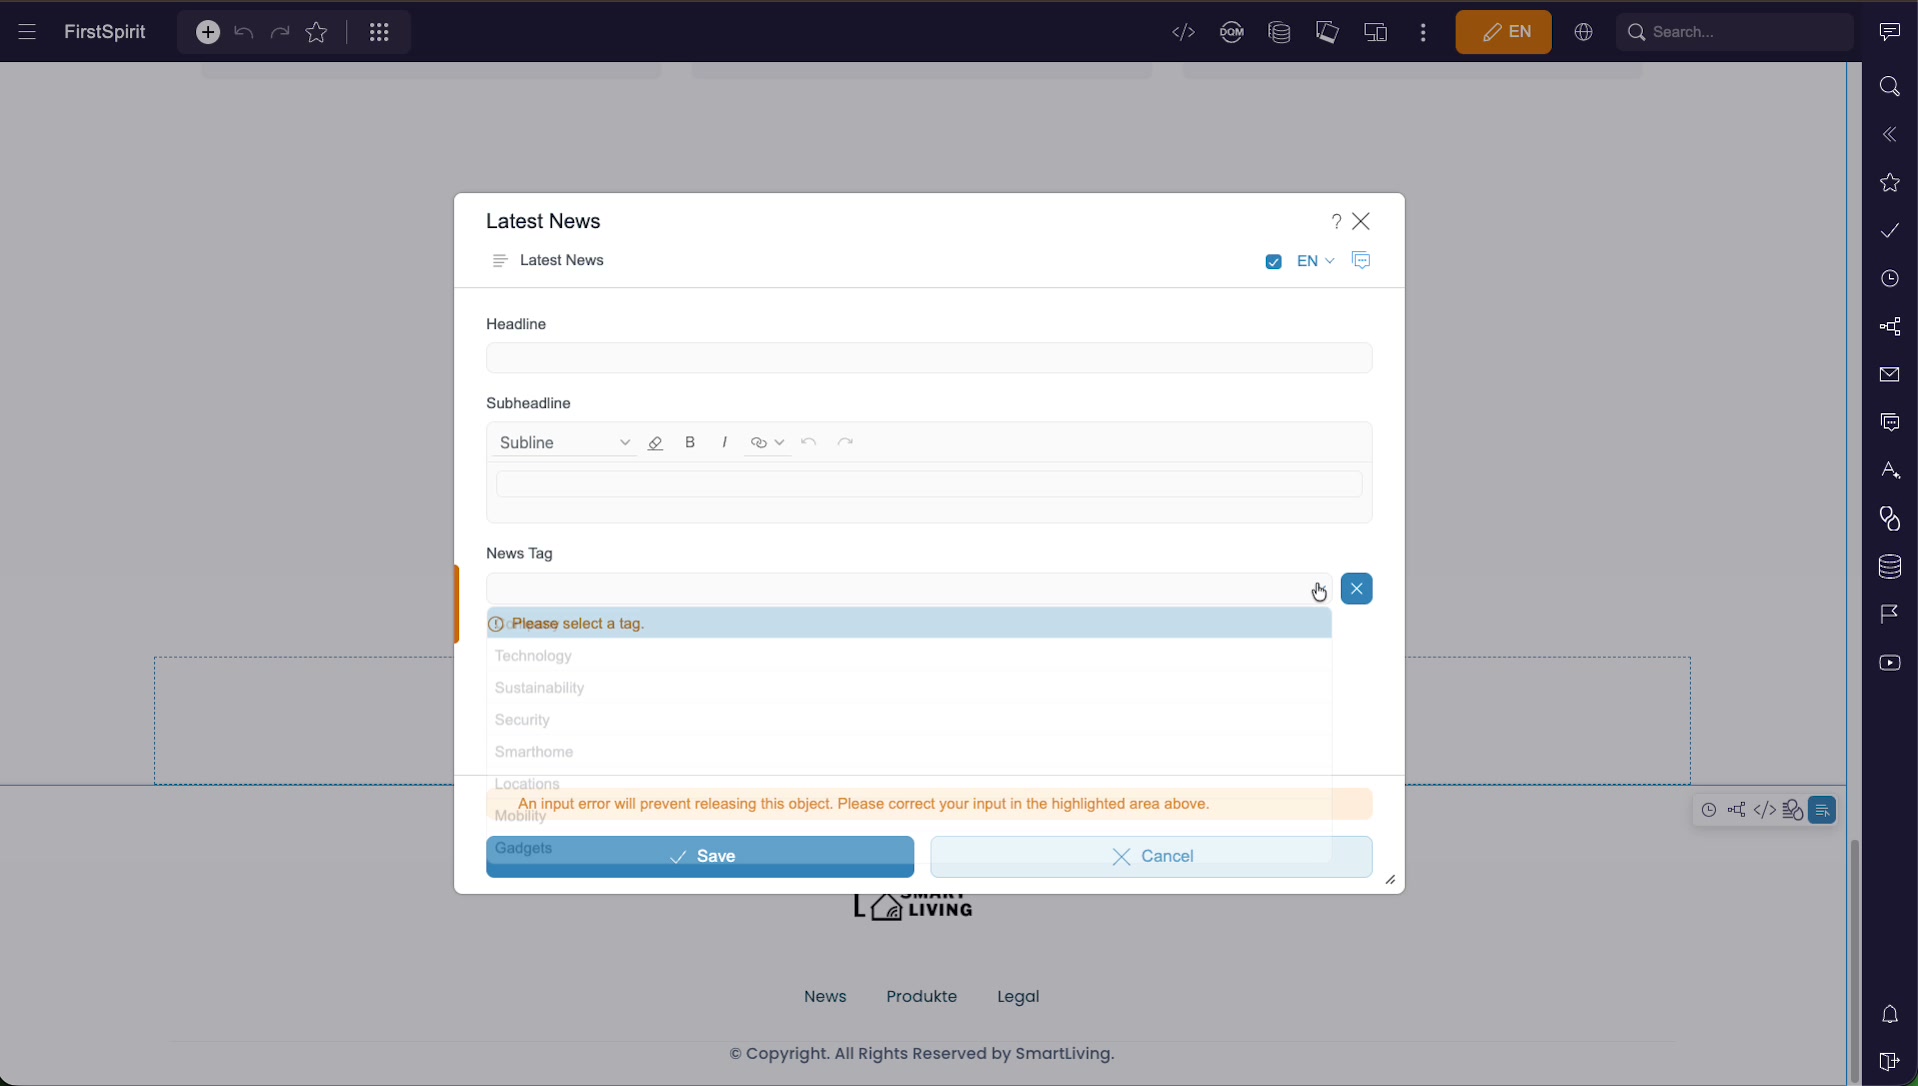
Once added, the section opens its own small form — the fields here are defined by the template author, so the exact set varies by project. In the example used throughout this guide, the section lets you set a Headline and Subheadline for the block, plus a News Tag that decides which articles the section shows. Its tag choices happen to match the categories used on the example datasets:
- Technology
- Sustainability
- Security
- Smarthome
- Locations
- Mobility
- Gadgets
Pick a tag and the section renders the matching datasets automatically — you never paste article content into the page, you point the section at the data. A different project might filter by a different field, offer no filter at all, or expose entirely different configuration options; the underlying mechanism — a section referencing a data source — is what matters, not this specific form.
One change, every channel
Because the section pulls live from the data source, the published page always reflects the current datasets. Add a new article to the News data source and it appears in the news overview and in every matching "Latest News" section — no page edit required.
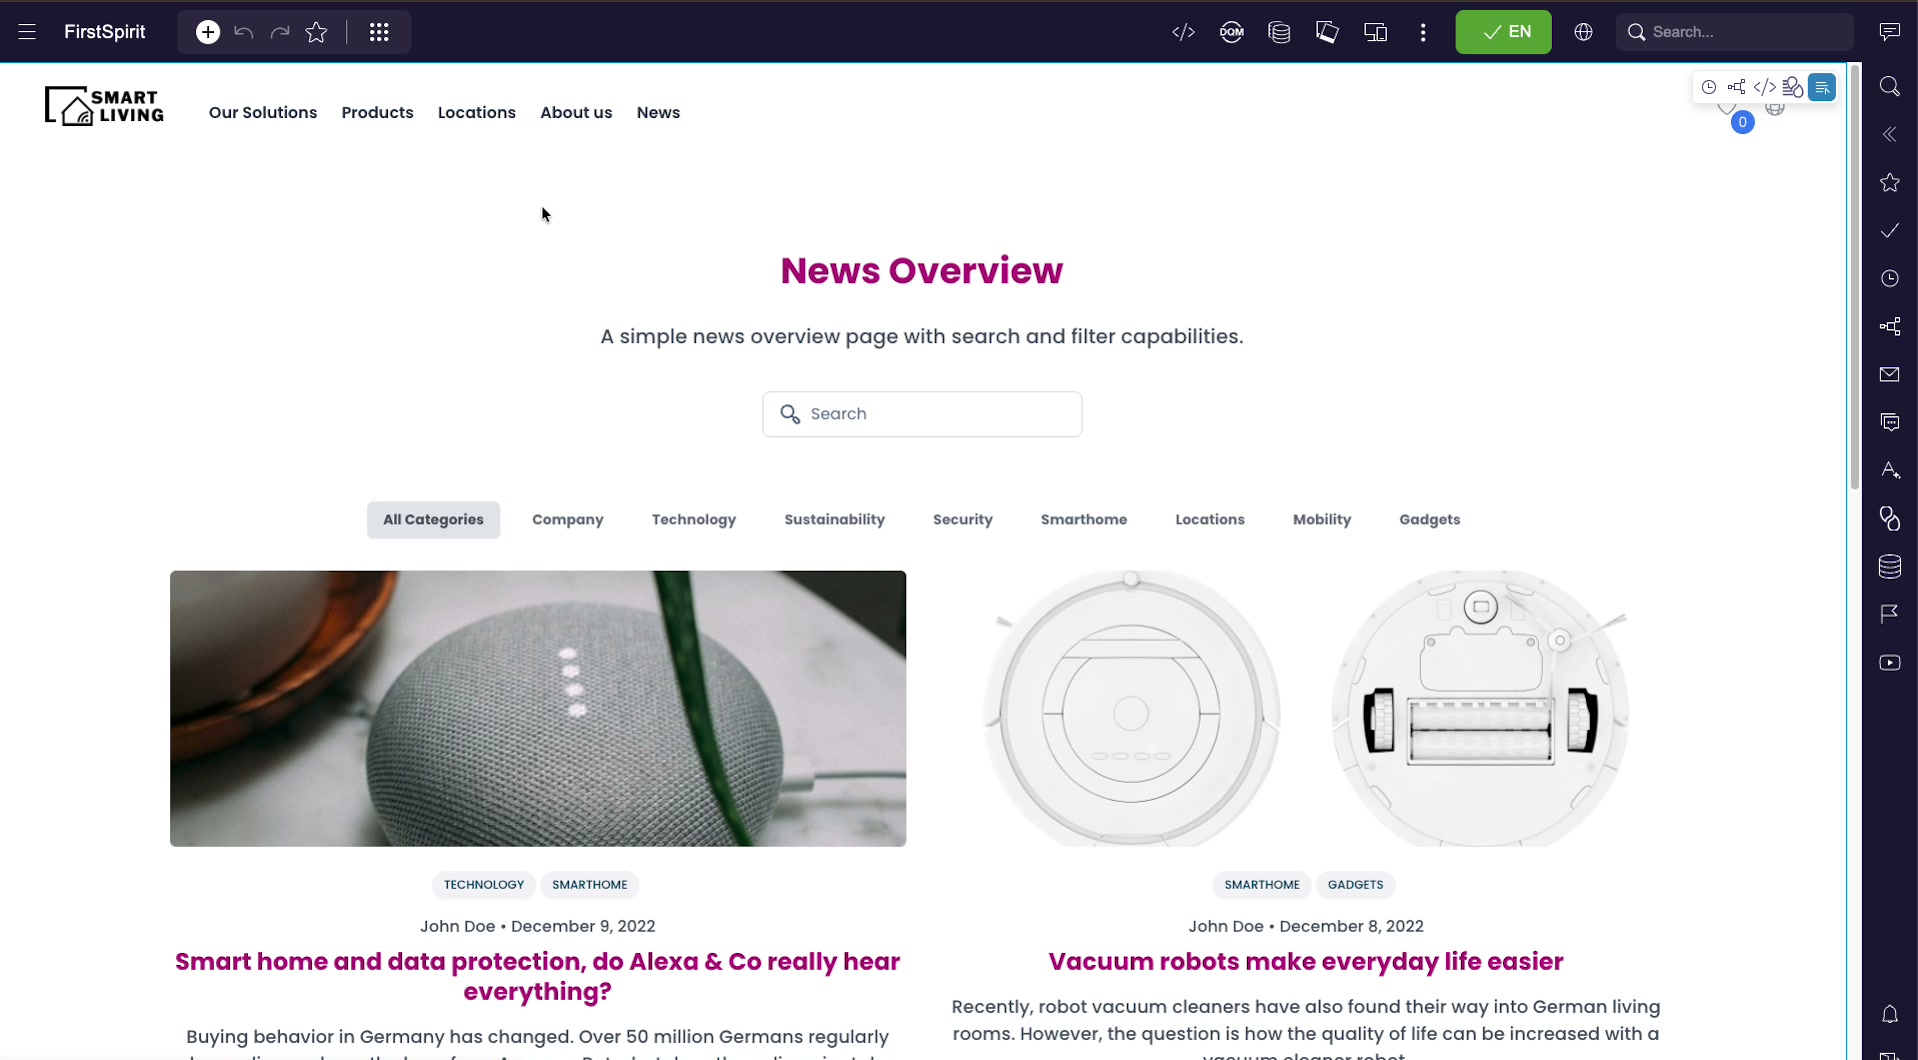
The Distribution field on each dataset makes this multi-channel: a record marked for both Website and App feeds the web pages and a mobile app from the same content. Structured, reusable data is what makes that omnichannel delivery possible.
Tips & good practice
- Edit the record, not a copy. Always change content in its dataset; never re-type article text directly onto a page.
- Tag consistently. Tags drive which sections pick up an article. Use the agreed category tags so new articles appear where they should.
- Fill required fields. Watch for validation messages — a record or section with errors can't be released.
- Write good alternative text. The image alt text travels with the dataset to every channel, so it matters for accessibility everywhere.
- Mind the Distribution. Check which channels a dataset targets before publishing — it may be feeding more than the page you're looking at.
- Search before you scroll. Use the report's search box to find datasets fast in large data sources.